The '''ValueGraphRecorder''' component is used to show a graph of values over time with a specified number of points worth of history. As new points are added, the graph is shifted sideways and old points are deleted.
<!--T:2-->
<!--T:2-->
== Fields ==
== Fields ==
{{Table ComponentFields
{{Table ComponentFields
|User|User| {{stub}}
|RecordingUser|{{RootFieldType|UserRef}}|TypeAdv0=true| The user handling updates for this component.
|_machineId|String| {{stub}}
|SourceValue|'''[[Type:IField`1|IField`1]]<[[Type:Float|Float]]>'''|TypeAdv1=true| The field that will be sampled for values.
|_userId|String| {{stub}}
|SourceValue|IField`1|TypeString1=IField<float>| The field that will be sampled for values.
|UpdateInterval|Float| The interval, in seconds, that the source field will be sampled at.
|UpdateInterval|Float| The interval, in seconds, that the source field will be sampled at.
|Points|Int| The number of samples to retain.
|Points|Int| The number of samples to retain.
|TargetArray|SyncArray`1|TypeString4=SyncArray<float>| The array to store samples in. Typically this will be the Values field in a [[StandaloneRectMesh (Component)|StandaloneRectMesh]]<LineGraphMesh>.
|TargetArray|'''[[Type:SyncArray`1|SyncArray`1]]<[[Type:Float|Float]]>'''|TypeAdv4=true| The array to store samples in. Typically this will be the Values field in a [[Compoment:StandaloneRectMesh|StandaloneRectMesh]]<[[Type:LineGraphMesh|LineGraphMesh]]>
|TargetArrayOffset|IField`1|TypeString5=IField<int>| The integer field containing the offset into the TargetArray to start storing samples at.
|TargetArrayOffset|'''[[Type:IField`1|IField`1]]<[[Type:Int|Int]]>'''|TypeAdv5=true| The integer field to set with the offset of where in the TargetArray to start showing samples at.
|MinRangeAdjustThreshold|Float| {{stub}}
|MinRangeAdjustThreshold|Float| If a value in the graph goes beyond this value for currently shown samples, adjust the graph minimum value.
|MinRangeAdjustMultiplier|Float| {{stub}}
|MinRangeAdjustMultiplier|Float| How much to increase the graph size downwards when adjusting for min value (1 is exactly to where the value edge is, 2 is add 2 times the needed value to show min on the graph.
|MaxRangeAdjustThreshold|Float| {{stub}}
|MaxRangeAdjustThreshold|Float| If a value in the graph goes beyond this value for currently shown samples, adjust the graph maximum value.
|MaxRangeAdjustMultiplier|Float| {{stub}}
|MaxRangeAdjustMultiplier|Float| How much to increase the graph size upwards when adjusting for min value (1 is exactly to where the value edge is, 2 is add 2 times the needed value to show min on the graph.
|RangeMin|'''[[Type:IField`1|IField`1]]<[[Type:Float|Float]]>'''|TypeAdv10=true| The field to drive with what the minimum range of the graph all points being shown is currently.
|RangeMax|'''[[Type:IField`1|IField`1]]<[[Type:Float|Float]]>'''|TypeAdv11=true| The field to drive with what the maximum range of the graph all points being shown is currently.
|Drive|Bool| {{stub}}
|Drive|Bool| Whether to use drive fields to drive target values rather than field pointers. Makes the calculations local.
|_arrayDrive|{{RootFieldType|DriveRef`1|[[Type:SyncArray`1|SyncArray`1]]<[[Type:Float|Float]]>}}|TypeAdv13=true| The field to drive with the set of samples. Typically this will be the Values field in a [[Compoment:StandaloneRectMesh|StandaloneRectMesh]]<[[Type:LineGraphMesh|LineGraphMesh]]>
|_arrayOffsetDrive|{{RootFieldType|FieldDrive`1|[[Type:Int|Int]]}}|TypeAdv14=true| The integer field to drive with the offset in the TargetArray to start showing samples at.
|_rangeMinDrive|{{RootFieldType|FieldDrive`1|[[Type:Float|Float]]}}|TypeAdv15=true| The field to drive with what the minimum range of the graph all points being shown is currently.
|_rangeMaxDrive|{{RootFieldType|FieldDrive`1|[[Type:Float|Float]]}}|TypeAdv16=true| The field to drive with what the maximum range of the graph all points being shown is currently.
}}
== Sync Delegates ==
{{Table ComponentTriggers
|WriteValue:[[Type:Action|Action]]|[[Type:Action|Action]]|false| force a write of a value to the graph rather than waiting on <code>Interval</code>
}}
}}
<!--T:3-->
<!--T:3-->
== Usage ==
== Usage ==
{{stub}}
Attach to a slot and use with a [[Component:StandaloneRectMesh]] on a [[Component:MeshRenderer]] with a material to view. Use either the fields or drive fields to drive aspects of the graph display for viewing the graph line.
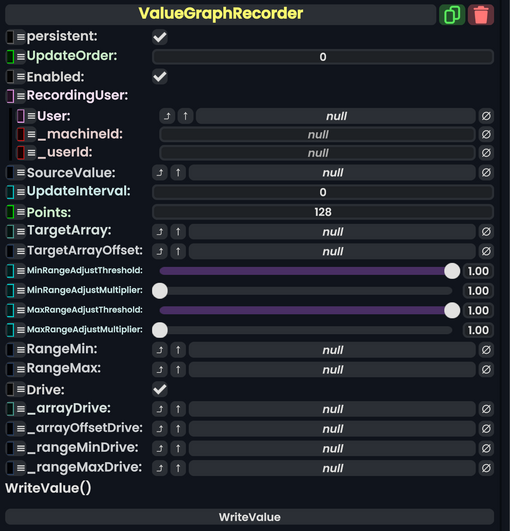
Value Graph Recorder component as seen in the Scene Inspector
The ValueGraphRecorder component is used to show a graph of values over time with a specified number of points worth of history. As new points are added, the graph is shifted sideways and old points are deleted.
How much to increase the graph size downwards when adjusting for min value (1 is exactly to where the value edge is, 2 is add 2 times the needed value to show min on the graph.
How much to increase the graph size upwards when adjusting for min value (1 is exactly to where the value edge is, 2 is add 2 times the needed value to show min on the graph.
force a write of a value to the graph rather than waiting on Interval
Usage
Attach to a slot and use with a Component:StandaloneRectMesh on a Component:MeshRenderer with a material to view. Use either the fields or drive fields to drive aspects of the graph display for viewing the graph line.
Examples
This article or section is a stub. You can help the Resonite wiki by expanding it.