|Texture|{{RootFieldType|AssetRef`1|[[Type:Texture2D|Texture2D]]}}|TypeAdv4=true| The texture to analyze and use to generate the vertex graph for this mesh.
|ColorSpace|'''[[#Space|Space]]'''|TypeAdv5=true|
|ColorSpace|'''[[#Space|Space]]'''|TypeAdv5=true| The color space to use for X, Y, and Z coordinates on the graph for.
|MaxTextureSize|Int| The max size of the image on one axis that this image will use when making the graph
|MaxTextureSize|Int| The max size of the image on one axis that this image will use when making the graph. The image gets resized internally to fit this size.
|BaseSize|Float|
|BaseSize|Float|
|AccumulateSize|Float|
|AccumulateSize|Float|
|MaxSize|Float|
|MaxSize|Float|
|Scale|Float3|
|Scale|Float3|
|AlphaThreshold|Float|
|AlphaThreshold|Float|
}}
== Space ==
{{Table EnumValues
|RGB|0| Convert colors in the image into RGB (Red Green Blue) values and use them as the graphs's XYZ values.
|HSV|1| Convert colors in the image into HSV (Hue Saturation Value) values and use them as the graph's XYZ valuee.
}}
}}
<!--T:3-->
<!--T:3-->
== Usage ==
== Usage ==
Attach this component to a slot, and place it into a [[Component:MeshRenderer|Mesh Renderer Component]] with an [[Component:UnlitMaterial|Unlit Material]] set to use billboard geometry to view the mesh and its graph points.
<!--T:4-->
<!--T:4-->
Revision as of 13:42, 29 October 2024
This article or section is a stub. You can help the Resonite wiki by expanding it.
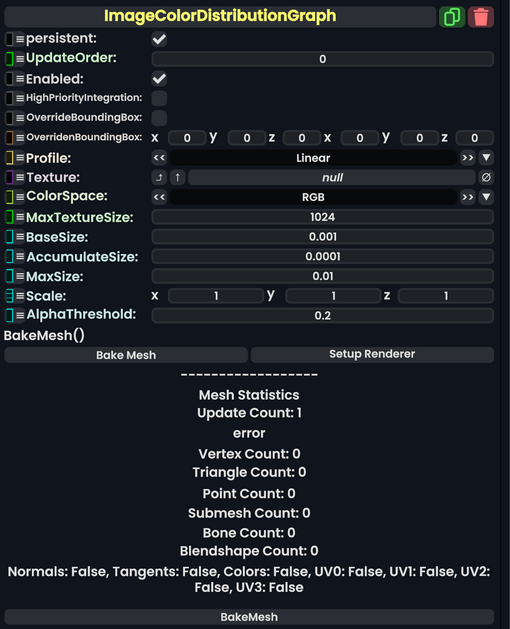
Component image
Image Color Distribution Graph component as seen in the Scene Inspector
If true, integrating this asset (e.g. processing procedural assets) gets higher priority than assets with this flag off. An example is user laser procedural meshes.
the bounding box this component should say it has when OverrideBoundingBox is enabled. Useful for bounding box calculations with Flux, or changing the selection box for this component when rendered.
Convert colors in the image into RGB (Red Green Blue) values and use them as the graphs's XYZ values.
HSV
1
Convert colors in the image into HSV (Hue Saturation Value) values and use them as the graph's XYZ valuee.
Usage
Attach this component to a slot, and place it into a Mesh Renderer Component with an Unlit Material set to use billboard geometry to view the mesh and its graph points.
Examples
An example of this component in use with an Unlit Material set to billboard geometry.

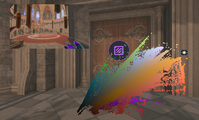 An example of this component in use with an Unlit Material set to billboard geometry.