Flight Data Recorder
More actions
Flight Data Recorder is a ProtoFlux logging tool made by TheAutopilot. It consists of an interactive UIX window that you can connect to multiple “probes” which mimic ProtoFlux nodes. (including handling of packing)
Log Window

After setting up the probe links this is where you will look most at during logging.
Do you want to get the most up-to-date version of this tool? Grab the Public Folder from the backside of this window!
Alternatively paste this into Resonite: resrec:///U-TheAutopilot/R-15a4b80b-d8d9-4502-92df-61b7c2bf3355
Title Bar
The title bar contains 3 buttons:
- Gear
- opens/closes the settings
- Pin
- parents the window to the user
Log
The log area is a table displaying a list of recorded events. There are two types of columns.
Event Column
This always is the first column of the table. Each event cell is made up of 3 rows:
- row
- an indicator for the event type (Σ for value changes, » for impulse events)
- the ID of the event source
- a button to show the event source in an inspector panel
- row
- a decorative clock symbol
- the world time of the event in millisecond precision
- the UTC time of the event without date in millisecond precision
- a button to restore the logged values to the state logged in the line (more details in section Restore Values)
- row
- a decorative user symbol
- name of the user where the event happened
- a button to start playing back from this log line (disables recording as a side-effect, more details in section Playback)
Value Column
These columns can be moved around with primary. (internally uses a UIX Slider) Each value cell consists of two rows:
- row
- a Σ if the value exists
- the type of the value (if not null)
- an indicator to tell if the raw value has been stored (green: can be applied to restore values)
- a button to show the value source in an inspector panel
- row with one of the following
- ∅ to indicate no data
nullfor a null value- a string representation of the value (IWorldElements are followed by two buttons to open an inspector panel.)
Scroll Bar
The scroll bar allows quick navigation through the log. (implemented by connecting a Slider with a ScrollRect)
Due to UI limitations some rendering issues are to be expected while quickly moving through the list.
Log Config/Actions
Recording
This is a checkbox to enable/disable creation of new log items.
Show Rich Text
This checkbox toggles if the values are displayed with text formatting.
Continue / Pause
This button continues playback if paused or pauses playback when playing. If playback has never been used yet or if the log line that has been paused on is destroyed, it will play from the first log line.
Enabling playback disables recording.
Current State / Playback Progress / # of log lines
Two rows of text indicate current state of recording/playback and the total number of log lines.
During playback the index of the next restored log line is displayed.
Seek to Start
This restarts playback beginning with the first log line.
Playback Speed
A collection of UI elements can be used to modify the playback speed:
- arrow buttons to increment/decrement by 10%
- a slider for more smooth changes
- a text input to explicitly set values
- a ∅ button to reset speed to 100%
Clear Log
This deletes all log entries
Export
This action is still in development. (goal: CSV or JSON export)
Settings Windows
The main responsibility of the Settings window is to manage probes. Additionally a few general settings and user settings are available.
Probe Management

Probes
This is a table of linked probes, grouped by probe type. (also scrollable with a scroll bar) The header of a group can be clicked to collapse the list of probes.
The displayed colums are:
- a checkbox to enable/disable the probe/group as a trigger for log lines.
- an indicator for the group type (Σ for value probes, » for impulse probes)
- ID of the probe/type of the group
- version of the probe
- A yellow arrow indicates that the probe can be updated to a newer version by clicking the version.
- a button to show the probe in an inspector panel
- a button (trashcan) to unlink the probe (This will NOT delete the probe itself.)
- a checkbox to show/hide the columns of a single/all value probes
- This is a way to generate a missing column after renaming a probe.
In a freshly spawned logger the empty probe list will be occupied by a quick start guide.
Link Probes
This action will ensure links to all probes within the given target hierarchy.
It will also ensure a matching column exists for the ID of each linked value probe.
Unlink All Probes
This action unlinks all probes.
As a side effect this will show the quick start guide again.
General Settings

Multiline Data
This option enables extra handling of duplicate data IDs which will generate additional log lines to display the extra values. (disable to improve performance)
Record Restore Data
This option enables recording the raw values. (enable to support restoring values, disable to improve performance)
Raw values are internally stored within duplicated Stores of Object type and communicated via additional Dynamic Impulses. They cannot be transmitted via the network. Once the logging user left the session the values are not recoverable. Duplication or saving also fails to preserve the raw values.
max. log size
This setting will limit the number of log lines stored within the log. The oldest lines will be deleted first after reaching this limit.
max. per frame
This setting will limit the number of log lines that can be added per frame. Once hitting the limit one additional line will be added with the number of skipped event lines.
Show Tooltip
This setting defines if the built-in tooltip display will be used to display additional information about UI elements.
Reset Columns
This action removes all unused value columns and generates all that are referenced by linked probes or log entries.
This may be necessary after changing the ID of already linked value probes.
Settings Tilt
This setting allows you to tilt the settings windows down by 15°, 30° or 45°.
User Settings

Each line allows to configure if the affected user(s) can record log lines (left column) or restore data. (right column)
(new users)
This is the default-configuration for new users joining the session. (known users keep their settings)
(all users)
This allows chaning the setting for all known users at once.
Individual User Setting
This area contains a line per user with their individual settings. Everyone can change everyone's settings.
User settings are not persisted but stay when a user temporarily exits the session.
The settings are managed per User ID. A user who joined a session with multiple Resonite instances can only be configured once.
Impulse Probe
Impulse probes add log lines for each impulse that goes through them.
Without a connected logger they behave like Continuation Relays. This includes their behaviour on deletion. (maintains connection) With connected loggers they will first trigger log line generation and then continue execution.
Inputs
Value (Object)
This is the value that will be added to the log table.
Outputs
OnRestore (Call)
This impulse will be triggered to restore the measured value.
Globals
ID (String)
This is the ID of events triggered by this probe. It will be displayed with text formatting. (unlike the IDs of value probes)
Value Probe
Value probes add additional columns to the log and can also trigger log lines on local value changes.
Additionally they have outputs that can be used to restore values.
Inputs
Value (Object)
This is the value that will be added to the log table.
Outputs
OnRestore (Call)
This impulse will be triggered to restore the measured value.
RestoredValue (Object)
This is the original value that should be restored during the impulse.
Globals
ID (String)
This is the ID of the value column and events triggered by this probe. It will be displayed without text formatting. (unlike the IDs of impulse probes)
Usage
Integration into ProtoFlux

Probes can be instanced from the templates below the logging window and integrated into your Protoflux like regular protoflux nodes.
Impulse probes - aside from logging - act like relays and should not disturb your control flow.
They can be compared to a call of console.log() in JavaScript with its ID as the first argument.
Place them at all places that may be relevant for what you want to observe!
Value probes just need their input connected - a cast node will be created automatically by Resonite.
They can be compared to additional arguments of the call to console.log. Unless disabled they may also trigger log entries on on their own.
You do not need the output side unless you are interested to restore values from log entries.
Properly assigning IDs is highly recommend but not a strict requirement if you are just running a quick test. Impulse probes even support rich text formatting.
-
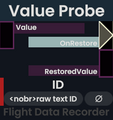 Value Probe: raw text IDs
 -
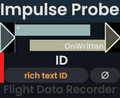 Impulse Probe: rich text IDs


Linking Probes
Log event triggers and receivers are separate parts and need to be connected to work. To do that simply drag the parent of your Protoflux into the input of the Link Probes button and click it.
Changing IDs of value probes may require a press on Reset Columns to fix displayed columns in the log.
Recording Events
In this phase you interact with your project. Click it, change values, throw it at a wall and see if it sticks! The more focused you search the easier it is to spot abnormal situations. This also means that you may at times want to disable logging from a part of all probes.
Once you found something of interest, stop logging completely and go through the log line by line and check if what happened aligns with what you expected!
If you can't explain yourself why stuff happened you may just need more information, don't hesitate to throw more probes at your problem: - Logging inputs to your computations or secondary outputs of e.g. Read Dynamic Variable can help verify the assumptions you had when creating your ProtoFlux. - Did your impulse chain end prematurely? Add impulse probes at intermediate positions (e.g. after branches) or dead-ends!
Restore Values

Sometimes it can be hard replicating a problem. An example would be an object that you can throw around but sometimes it phases through the floor. It could depend on the direction or velocity of your throw. Maybe it depends on the impact point. So how can you reliably repeat the error? (e.g. after you added additional logging)
The outputs of the value probes are meant offer a solution: With two nodes - a cast/unbox and some kind of “write” action - you can restore many directly observed states.
To trigger the restore action you need to click on the button next to the event time in the Event Column!
This only works if Record Restore Data was enabled for the given log line and only for value probes that already existed at the time. (Matching is done by identity of the probe and not by the ID field to avoid issues with duplicate IDs.)
Playback
Playback is restoring values in sync with time. This can be used to visualize recorded motion in original or modified playback speed.
Recording and playback are mutually exclusive.
Playback can be started with a triangle button of the log event column or with the Continue / Pause button below the log entries.
When running it will be updated locally by every user. Restore actions will only be triggered when enabled for the local user and only for lines owned by them.
Each user will remember the last event line they have restored when paused and will start from the next line when playback is continued.
It is guaranteed that all locally-owned lines will be processed only by their owners, in order, without duplication and without skipping.
Order among users cannot be guaranteed but playback in general follows World Time on each user.
Version History
- 1.0
- Initial Release
- 1.1
-
- Added: "Quick Start" guide to the settings menu when no probes are linked
- Changed: value probes to only compute their input if any linked logger is actively observing it (left column is checked)
- Note: This feature introduces new assumptions to the links between logger and probe. This may disable events for all loggers if a new value probe is connected to an old logger which has disabled events from that node. Solution: switch to the new logger version
- Fixed: combination of rate-limit and additional data lines
- Fixed: spacing for collapsed link types in settings menu
- 1.2
-
- Added: display for version number of linked probes
- Outdated versions are highlighted and can be clicked to replace the probes with the newest version.
- Known bug: patching packed probes causes Protoflux to partially unpack
- Added: display for version number of linked probes
- 1.2.1
- Fixed: Patching probes unpacks ProtoFlux.
- Fixed: Patching, then duplicating reparents link objects under Root.
- 1.3
-
- Added: GrabInstancer for public directory on the back
- Added: restore feature for value probes that allows you to go back in time
- Added: Probes follow "Overview Mode" setting of FluxTip.
- Added: Probes are now selectable by the FluxTip. (but not unselectable)
- Changed: reduced number of spawned Protoflux visuals
- Fixed: Resonite log file spam due to missing value
- Fixed: world crash under some circumstances
- Known bug: Probes cannot be deselected without being connected to normal nodes.
- Known bug: Protoflux selection is not visible on probes.
- Known bug: Value Probes of this version are missing patching metadata for the new outputs. (will remain disconnected after patching)
- 1.3.1
-
- Added: option to not save restore data (performance vs. feature trade-off)
- Added: indicator to show if restore information is available for a value
- Added: post-patch migration code
- currently used to tell you that the new restore outputs of the old 1.3.0 value probes cannot be migrated properly (Solution: You have to connect them manually after patching.)
- Added: option to render data cells as rich text
- Changed: Output formatting now uses invariant culture.
- Changed: rich text formatting of probe IDs depends on type of probe
- Value probes are rendered raw as the IDs are also used to identify their column. (avoids confusion why a "color change" mismatches the column)
- Impulse probe IDs are rich text to make it easier to highlight events with colors.
- Fixed: missing patch data of value probe (restore outputs)
- Fixed: world crash under some circumstances
- Fixed: issues with packing/unpacking (e.g. "ghost" nodes appearing or accidental unpacking after packing)
- Fixed: being able to copy restore information stored in Stores (Content is lost when attempting to copy!)
- 1.3.2
-
- Change: adjusted child order to fix issue with OpenPrint
- Known bug: Patching unpacks packed Protoflux
- 1.4
-
- Added: tooltips to all buttons and most displays (including items in tabular views)
- Added: option to toggle tooltips
- Added: links to Wiki and tutorial videos, includes feature to spawn video player in-world
- Change: improved node output names (super minor change: no version bump)
- Fixed: missing icon for migration events
- 1.5
-
- Added: Playback feature
- Playback restores log lines in sync with time. (locally for each user but only their own lines)
- Playback can be started from a log line.
- Playback can be paused/continues/reset via UI at the bottom of the log display.
- Playback speed can be adjusted. (negative speeds are not yet supported)
- Added: Status information (located within the playback panel)
- Added: per-user recording/restore settings
- There is a special option to configure joining users. Use this to prevent log data from unexpected visitors!
- Added: settings menu tilt option
- Changed: split settings menu into 3 separate canvases
- Changed: improved logging performance, especially for values of type: null, bool, int, float, float2, float3, float4, floatQ, float4x4, string and any subtype of IWorldElement
- Removed: X to close logging window. (reason: too easy to click accidentally with the consequence of loosing data)
- Added: Playback feature
Protocols
TODO: This will be the place to document the communication between probes and the logger.