Flight Data Recorder is a ProtoFlux logging tool made by TheAutopilot. It consists of an interactive UIX window that you can connect to multiple “probes” which mimic ProtoFlux nodes. (including handling of packing)
Log Window

After setting up the probe links this is where you will look most at during logging.
Do you want to get the most up-to-date version of this tool? Grab the Public Folder from the backside of this window!
Alternatively paste this into Resonite: resrec:///U-TheAutopilot/R-15a4b80b-d8d9-4502-92df-61b7c2bf3355
Title Bar
The title bar contains 3 buttons:
- Gear
- opens/closes the settings
- Pin
- parents the window to the user
- X
- destroys the logging tool (This also deletes all collected log data!)
Log
The log area is a table displaying a list of recorded events.
There is two types of columns.
Event Column
This always is the first column of the table. Each event cell is made up of 3 rows:
- row
- an indicator for the event type (Σ for value changes, » for impulse events)
- the ID of the event source
- a button to show the event source in an inspector panel
- row
- a decorative clock symbol
- the world time of the event in millisecond precision
- the UTC time of the event without date in millisecond precision
- a button to restore the logged values to the state logged in the line (More details in section Restore Values)
- row
- a decorative user symbol
- name of the user where the event happened
Value Column
These columns can be moved around with primary. (internally uses a UIX Slider) Each value cell consists of two rows:
- row
- a Σ if the value exists
- the type of the value (if not null)
- an indicator to tell if the raw value has been stored (green: can be applied to restore values)
- a button to show the value source in an inspector panel
- row with one of the following
- ∅ to indicate no data
nullfor a null value- a string representation of the value (IWorldElements are followed by two buttons to open an inspector panel.)
Scroll Bar
The scroll bar allows quick navigation through the log. (implemented by connecting a Slider with a ScrollRect)
Due to UI limitations some rendering issues are to be expected while quickly moving through the list.
Log Config/Actions
Recording
This is a checkbox to enable/disable creation of new log items.
Show Rich Text
This checkbox toggles if the values are displayed with text formatting.
Clear Log
This deletes all log entries
Export
This action is still in development. (goal: CSV or JSON export)
Settings Window

The main responsibility of the Settings window is to manage probes. Additionally a few general settings are available.
Probe Management
Probes
This is a table of linked probes, grouped by probe type. (also scrollable with a scroll bar) The header of a group can be clicked to collapse the list of probes.
The displayed colums are:
- a checkbox to enable/disable the probe/group as a trigger for log lines.
- an indicator for the group type (Σ for value probes, » for impulse probes)
- ID of the probe/type of the group
- version of the probe
- A yellow arrow indicates that the probe can be updated to a newer version by clicking the version.
- a button to show the probe in an inspector panel
- a button (trashcan) to unlink the probe (This will NOT delete the probe itself.)
- a checkbox to show/hide the columns of a single/all value probes
- This is a way to generate a missing column after renaming a probe.
In a freshly spawned logger the empty probe list will be occupied by a quick start guide.
Link Probes
This action will ensure links to all probes within the given target hierarchy.
It will also ensure a matching column exists for the ID of each linked value probe.
Unlink All Probes
This action unlinks all probes.
As a side effect this will show the quick start guide again.
General Settings
Multiline Data
This option enables extra handling of duplicate data IDs which will generate additional log lines to display the extra values. (disable to improve performance)
Reset Columns
This action removes all unused value columns and generates all that are referenced by linked probes or log entries.
This may be necessary after changing the ID of already linked value probes.
Record Restore Data
This option enables recording the raw values. (enable to support restoring values, disable to improve performance)
Raw values are internally stored within duplicated Stores of Object type and communicated via additional Dynamic Impulses. They cannot be transmitted via the network. Once the logging user left the session the values are not recoverable. Duplication or saving also fails to preserve the raw values.
max. log size
This setting will limit the number of log lines stored within the log. The oldest lines will be deleted first after reaching this limit.
max. per frame
This setting will limit the number of log lines that can be added per frame. Once hitting the limit one additional line will be added with the number of skipped event lines.
Impulse Probe
Impulse probes add log lines for each impulse that goes through them.
Without a connected logger they behave like Continuation Relays. This includes their behaviour on deletion. (maintains connection) With connected loggers they will first trigger log line generation and then continue execution.
Inputs
Value (Object)
This is the value that will be added to the log table.
Outputs
OnRestore (Call)
This impulse will be triggered to restore the measured value.
Globals
ID (String)
This is the ID of events triggered by this probe. It will be displayed with text formatting. (unlike the IDs of value probes)
Value Probe
Value probes add additional columns to the log and can also trigger log lines on local value changes.
Additionally they have outputs that can be used to restore values.
Inputs
Value (Object)
This is the value that will be added to the log table.
Outputs
OnRestore (Call)
This impulse will be triggered to restore the measured value.
RestoredValue (Object)
This is the original value that should be restored during the impulse.
Globals
ID (String)
This is the ID of the value column and events triggered by this probe. It will be displayed without text formatting. (unlike the IDs of impulse probes)
Usage
Integration into ProtoFlux

Probes can be instanced from the templates below the logging window and integrated into your Protoflux like regular protoflux nodes.
Impulse probes - aside from logging - act like relays and should not disturb your control flow.
They can be compared to a call of console.log() in JavaScript with its ID as the first argument.
Place them at all places that may be relevant for what you want to observe!
Value probes just need their input connected - a cast node will be created automatically by Resonite.
They can be compared to additional arguments of the call to console.log. Unless disabled they may also trigger log entries on on their own.
You do not need the output side unless you are interested to restore values from log entries.
Properly assigning IDs is highly recommend but not a strict requirement if you are just running a quick test. Impulse probes even support rich text formatting.
-
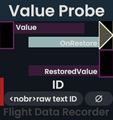 Value Probe: raw text IDs
 -
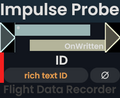 Impulse Prove: rich text IDs


Linking Probes
Log event triggers and receivers are separate parts and need to be connected to work. To do that simply drag the parent of your Protoflux into the input of the Link Probes button and click it.
Changing IDs of value probes may require a press on Reset Columns to fix displayed columns in the log.
Recording Events
In this phase you interact with your project. Click it, change values, throw it at a wall and see if it sticks! The more focused you search the easier it is to spot abnormal situations. This also means that you may at times want to disable logging from a part of all probes.
Once you found something of interest, stop logging completely and go through the log line by line and check if what happened aligns with what you expected!
If you can't explain yourself why stuff happened you may just need more information, don't hesitate to throw more probes at your problem: - Logging inputs to your computations or secondary outputs of e.g. Read Dynamic Variable can help verify the assumptions you had when creating your ProtoFlux. - Did your impulse chain end prematurely? Add impulse probes at intermediate positions (e.g. after branches) or dead-ends!
Restore Values

Sometimes it can be hard replicating a problem. An example would be an object that you can throw around but sometimes it phases through the floor. It could depend on the direction or velocity of your throw. Maybe it depends on the impact point. So how can you reliably repeat the error? (e.g. after you added additional logging)
The outputs of the value probes are meant offer a solution: With two nodes - a cast/unbox and some kind of “write” action - you can restore many directly observed states.
To trigger the restore action you need to click on the button next to the event time in the Event Column!
This only works if Record Restore Data was enabled for the given log line and only for value probes that already existed at the time. (Matching is done by identity of the probe and not by the ID field to avoid issues with duplicate IDs.)
Version History
TODO
Protocols
TODO: This will be the place to document the communication between probes and the logger.