This page details information and various avenues related to optimizing assets or creations in Resonite, ranging from high-level concepts to technical details. Not everything on this page will be applicable to every creation, and the more technical parts of this page can result in diminishing returns with more effort/time. Therefore, do not worry too much about following everything on this page all the time, as just being aware of the high-level concepts will be enough for most users.
Rendering
Resonite currently uses Direct3D 11 for rendering in Unity. The D3D 11 technical specifications provide the most comprehensive information of the low-level pipeline, but is generally not useful to read directly.
Textures

There are two main metrics that can be optimized with textures: asset size and VRAM size.
Asset size is the size of the original asset file on disk (i.e. PNG, WEBP, etc.). Optimizing this metric is useful for saving on cloud storage space. If a texture has DirectLoad enabled, then reducing the asset size will also reduce the transfer size of the asset to other clients. Otherwise, the transfer size is determined by the variant size, not the asset size, which is more out of your control.
VRAM size is the size that the texture will take up in video RAM on the GPU. This metric is more important to optimize, as high VRAM usage will cause performance drops. VRAM size should be kept as low as reasonably possible.
Textures should only be as big as is necessary to express a "good enough" visual on a mesh, which will save on both asset size and VRAM. For avatars, a 2048x2048 ("2k") texture will usually be enough for most purposes. Larger textures may be needed for noisy normal maps, incredibly large meshes (e.g. splat maps), or texture atlasing.
Textures should almost always use some form of block compression to reduce their VRAM size. The only exceptions to this should be low-resolution textures that require color perfection (e.g. pixel art).
Square textures provide no real optimization benefit over non-square textures. Non-power-of-two textures are also not worse than power-of-two textures on any GPU made after the late 2000s. However, it is generally recommended to keep texture dimensions a power of two for better mipmap generation. At the very least, texture dimensions should be a multiple of 4 as this makes texture block compression not use any extraneous space.
If you are working with many small textures that require the same material, consider atlasing the textures into one large texture. All conventional materials have a TextureScale and TextureOffset field to manage atlasing at the shader level, which is much more efficient than using a bunch of individual textures. The UVAtlasAnimator component can be used to easily change these two fields, assuming a rectangular atlas of uniform sprite sizes.
Blendshapes
For every frame that a mesh is being rendered, if there is any blendshape set to a nonzero value, every vertex on the mesh is recalculated to account for blendshape distortions. This calculation does not scale with blendshape amount: 1 nonzero blendshape will be about as heavy as several nonzero blendshapes. As such, it is generally best practice to separate out parts of a mesh that are not affected by blendshapes and to bake non-zero blendshapes that do not change on a mesh.
However, no matter the value of the blendshape, when a skinned mesh is first spawned (e.g. when an avatar loads), Every blendshape must be calculated. This can cause reduced framerate while the mesh is being loaded depending on the vertex count, as well as cause the mesh to take several seconds to appear. It is recommended to separate out parts of a mesh with high-density blendshapes, such as a head with face tracking blendshapes, from the rest of the mesh. This can improve the mesh loading time while reducing framerate less.
Resonite can attempt to automatically do blendshape optimizations with the Separate parts of mesh unaffected by blendshapes and Bake non-driven blendshapes buttons found under the SkinnedMeshRenderer component. Additionally, there are functions to bake a blendshape by index or split a blendshape across an axis. Whether these optimizations are worth it or not varies on a case-by-case basis, so you'll have to test your before/after performance with nonzero blendshapes to be sure.
Materials
Some materials, notably the Fur material, are much more expensive than others. Take care in using the least-expensive materials that accomplish your goal.
Using the Opaque or Cutout blend mode on a material is generally advised whenever possible, as these blend modes use the deferred rendering pipeline and handle dynamic lights better. Alpha, Transparent, Additive, and Multiply blend modes are all treated as transparent materials and use the forward rendering pipeline, which is generally more expensive and don't handle dynamic lights as consistently.
Procedural assets
If you are not driving the parameters of a procedural mesh, then you can save performance by baking it into a static mesh. Procedural meshes and textures are per-world, as the procedural asset is duplicated with the item. Static meshes and textures are automatically instanced across worlds so there's only a single copy in memory at all times and do not need to be saved on the item itself.
GPU mesh instancing
Mesh instancing is when multiple copies of the same mesh are drawn at once, reducing the amount of draw calls to the GPU. If you have multiple instances of the same static mesh/material combination, they will be instanced on most shaders. This can significantly improve performance when rendering multiple instances of the same object, such as trees or generic buildings.
SkinnedMeshRenderers are not eligible for GPU instancing. Additionally, different material property blocks will prevent instancing across different copies of the same mesh, even if the underlying material is the same.
Mirrors and cameras
Mirrors and cameras can be quite expensive, especially at higher resolutions in complex worlds, as they require additional rendering passes. Mirrors are generally more expensive than cameras, as they require two additional passes (one per eye).
The performance of cameras can be improved by using appropriate near/far clip values and using the selective/exclusive render lists. Basically, avoid rendering what you don't need to.
In addition, it's good practice to localize mirrors and cameras with ValueUserOverride so users can opt in if they're willing to sacrifice performance to see them.
The complexity of the scene being renderered will affect how much a camera or mirror will hurt at a certain resolution. It is recommended to provide mirror or camera resolution options to worlds or items so users can choose what resolution suits them the most.
Reflection probes

_speed field on the Panner1D. The ChangesSources points to the ValueField<int>Baked reflection probes are quite cheap, especially at the default resolution of 128x128. The only real cost is the VRAM used to store the cube map. Even then, at low resoluitons, the VRAM usage is insignificant.
Realtime reflection probes are extremely expensive and are comparable to six cameras. Additionally, if the change sources for an OnChanges reflection probe update frequently, then the probe will be no better than a realtime reflection probe. If the change sources update continuously yet subtly, consider setting the change sources to something hooked up to a timer to only update the reflection probe every few seconds.
Lighting
Light impact is proportional to how many pixels a light shines on. This is determined by the size of the visible light volume in the world, regardless of how much geometry it affects. Short range or partially occluded lights are therefore cheaper.
Lights with shadows are much more expensive than lights without. In deferred shading, shadow-casting meshes still need to be rendered once or more for each shadow-casting light. Furthermore, the lighting shader that applies shadows has a higher rendering overhead than the one used when shadows are disabled.
Point lights with shadows are very expensive, as they render the surrounding scene six times. If you need shadows, try to keep them restrained to a spot or directional light.
It is possible to control whether a MeshRenderer or SkinnedMeshRenderer component casts shadows using the ShadowCastMode Enum value on the component. Changing this to 'Off' may be helpful if users wish to have some meshes cast shadows, but not all (and hence don't want to disable shadows on the relevant lights). Alternatively, there may be some performance benefits by turning off shadow casting for a highly detailed mesh and placing a similar, but lower detail, mesh at the same location with ShadowCastMode 'ShadowOnly'.
ProtoFlux
How much ProtoFlux optimization matters for you depends on what type of ProtoFlux code you are making. The optimization requirements for, say, incredibly hot loops with a lot of calculation are not the same as drives that only get evaluated a maximum of once per frame. ProtoFlux optimization can be a great rabbithole, and it's important to not try to do too much at the expense of readability or simplicity.
This snippet will mainly focus on "everyday user" flux, disregarding complex cases or hot loops for maximum performance gain. It will not be extensive nor deep. If you are interested in extreme ProtoFlux optimization, check out the ProtoFlux optimization page.
Overall
Less ProtoFlux is not always better! It's more important to make your calculations do less work than it is to do them in a smaller space. Users should also not feel pressured to avoid using ProtoFlux because they believe using 'only components' is somehow more optimal. There are many cases where specific components are a better solution than using several ProtoFlux nodes and vice-versa, the decision mainly comes down to using the best tool for the job.
Writes and drives
Impulse chains, and thus writes to a field, allow for more explicit evaluation flow, while drive chains are more implicit in when nodes get evaluated. This means that you have more control over when things can be re-evaluated using careful impulse chains and listening to values yourself instead of letting the game do it for a drive chain.
By default, writing to a field will incur network traffic at the end of the update. Multiple writes can be done in one update and only the last write will induce traffic. To prevent network traffic, one can either drive a field or a self-driven ValueCopy component with writeback to "localize" the field for writing.
Dynamic impulses
Dynamic impulses are used to dynamically call "receivers" of some tagged impulse under a slot hierarchy. This works by recurviely looking at all children of the input slot given to a trigger node and seeing if there is a receiver. As such, it is recommended to minimize the scope of a dynamic impulse as much as is reasonable, should the impulse be called very frequently.
Continuously changing drive chains
Certain nodes are marked with an attribute called ContinuouslyChanging. This will cause any listener node that use the output of the original node to re-evaluate the entire input chain every update. A list of these nodes can be found on the Category:ContinuouslyChanging nodes page.
If potentially-heavy nodes are used in such a chain, such as BodyNodeSlot or ProtoFlux:FindChildByName, this can be a silent killer of performance depending on how heavy the chain is and how many instance of the flux exist.
It is highly recommended to, if you are using any heavy node in a chain that is marked continuously changing, to see if the result of the heavy node can be written to a Store whenever it may need to be updated. This would allow the heavy node to not be re-evaluated every update.
Measuring ProtoFlux runtime
The runtime of a ProtoFlux Impulse chain can be measured using Utc Now and a single variable storing its value just before executing the measured code. Subtracting this value from the one evaluated just after the execution yields the duration it took to run. Take note that this does not measure indirect performance impacts like increased network load or physics updates!
-
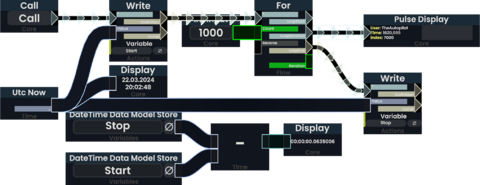 Measuring the runtime of a ProtoFlux loop. Practical applications should format the output to be more readable.

Measuring the performance impact of ProtoFlux drives is not as straightforward. The most sensible approach would be to create an Impulse based measurement to measure the runtime of a simple Write node connected to same expression as the drive.
If you—for whatever reason—need to compute the execution time during drive evaluation, you could abuse the order of evaluations:
-
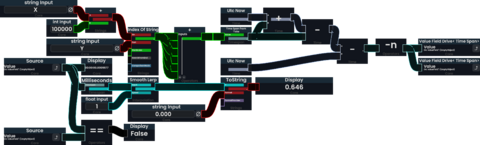 Measuring the runtime of a ProtoFlux drive with a smoothened and formatted output. The measurement itself is very dependent on how ProtoFlux is implemented. (->not recommended)

Common performance myths
A few myths occasionally propagate regarding optimization. This list serves to state the truth of the various discussions:
- In general, slot count does not inherently matter for the performance of an object. Should anything iterate over the slots or elements of an object, it will matter, but not in the general case.
- In general, there is no notable difference in performance between using ProtoFlux versus components for driving values. Performance differences would occur on a case-by-case basis depending on the complexity of the component and the potential re-implementation in ProtoFlux.
Culling
Culling refers to not not rendering or processing specific parts of a world or certain slots to reduce performance costs. Resonite currently has built-in frustrum culling for rendering meshes, but this does not affect any CPU-based stuff like ProtoFlux or components. It is recommended to set up some sort of additional world-based culling if your world is large and complex. There are also user-made systems to cull only user avatars in a world for a potential per-session performance increase with a large number of users.
Profiling
Profiling, in general, is the act of measuring what and where is taking up the most of a particular resource. Profiling can be used to help determine what is taking up the most CPU or GPU frame time in a world. Some methods of profiling a world or item include:
- The Debug facet on the home screen of the dash menu provides timings for various aspects of Resonite. The two most useful tabs here are the Worlds and Focused World tabs, the latter of which will show the time it takes to execute every part of the world update cycle.
- The ResoniteMetricsCounter mod provides timings for various slot hierarchies, protoflux chains, and components in the current session.
- Do not take the exact timings at face value, as there is non-insignificant overhead from patching everything that is required for the mod to work. Nevertheless, it serves as an excellent tool for exploring what is relatively taking up the most frame time in a world.
- The dotnet-trace tool is able to perform in-depth traces of FrooxEngine and enumerate what functions are taking up the most runtime. While it provides the most extensive and accurate profiling, it can't single out individual slot hierarchies, ProtoFlux groups, or components, and is generally for more advanced users.
- SteamVR has a "Display Performance Graph" that can show GPU frametimes. This can also be shown in-headset from a toggle in the developer settings (toggle "Advanced Settings" on in the settings menu)
- fpsVR is a paid SteamVR tool that gives a lot of information about CPU and GPU timings, vram/ram usage and other metrics that can be very useful when profiling inside of VR.